Institute for Telecommunication Sciences / Research / Quality of Experience / Video Quality Research / Audiovisual Quality / Video MOS vs Speech MOS
Video MOS vs Speech MOS
By Margaret Pinson, July 2025
This white paper explains differences in how mean opinion scores (MOS) are calculated for video, speech, and audiovisual quality subjective tests.
ITU-R Rec. BT.500 addresses the specialized needs of broadcasters and contribution-quality television to conduct subjective video-quality tests. ITU-T Rec. P.910 describes best practices for Internet video, mobile devices, and new video technologies. ITU-T Rec. P.800 describes best practices for speech-quality tests. All three Recommendations use similar rating scales but calculate mean opinion scores (MOS) differently.
Image-quality and video-quality subjective tests use similar experiment designs, because images are a simplified case of “video without motion” when both are presented on digital monitors. Different scenes have a major impact on image and video impairments, which results in a wide variance of MOSs. While experiment designs focus on impairments, analyses focus on individual files (i.e., rating distributions for a single image or video file). Therefore, each video file is typically rated by 15 or 24 subjects. Audiovisual subjective tests follow these same trends.
Different talkers and utterances produce similar MOSs. Speech-quality analyses typically ignore the file response (e.g., distribution of ratings for a single speech file) in favor of condition response (e.g., a particular speech codec, bit-rate, and packet loss rate). Consequently, speech-quality tests typically contain fewer subject ratings per file (e.g., 6 to 12) and more files per condition (i.e., more source stimuli for each impairment).
Speech MOS is calculated by averaging all subject ratings for all speech samples associated with one system. When the same test is conducted at multiple labs, each lab uses different speech recordings (e.g., phonetically balanced sentences in the native language of that area).
At first glance, the speech MOS approach is superior, because more samples yield tighter confidence intervals. Unfortunately, the speech MOS strategy is not appropriate for video ratings, as was explained to me decades ago by Greg Cermak at Verizon (now retired) which I will paraphrase.
The pool of video sequences is chosen to represent the larger set of "all possible video sequences." The subject ratings associated with a video sequence indicate the quality of one particular video sequence, not the quality distribution of all video sequences. Thus, we can only improve our understanding of "all possible video sequences" by increasing the number of unique videos in the dataset. Speech MOS can safely ignore this constraint because the diversity of "all possible speech signals" is relatively small. By contrast, the diversity of "all possible video sequences" is enormous.
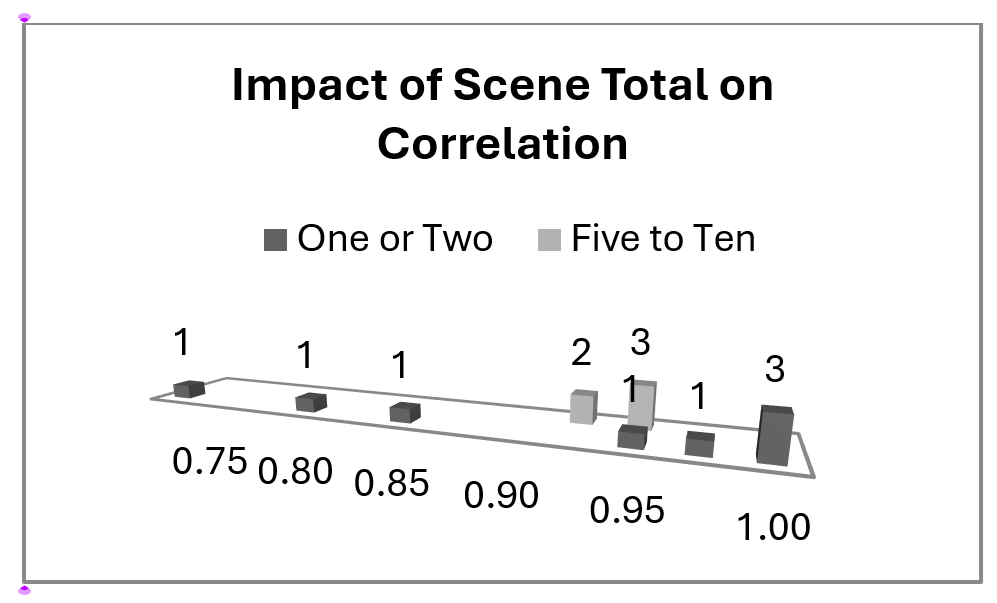
To visualize the large variety of video content and their impact on MOSs, see the Figure below, from "How to choose video sequences for video quality assessment." The figure plots the relationship between MOSs and a theoretical model for audiovisual quality integration. Thirteen datasets conducted the same experiment and measured the accuracy of this model using Pearson correlation. The correlations are split by the number of scenes in the experiment: limited (one or two) and normal (five to ten). The former spans the range [0.72..0.99], indicating that chance played a large role. The latter are tightly clustered, indicating a high degree of repeatability.